Listening to a Restless Planet: Inside Modern Volcanic Activity Monitoring
Beneath many quiet peaks, a hidden network of instruments listens and watches for change. Small quakes, shifting slopes, faint heat, and drifting gases are tracked day and night, then compared with satellite images and other records. Combined, these signals help specialists understand when a usually calm landscape is becoming more active and potentially more hazardous.
This story is part of DailySeekers's practical reading library across everyday topics.
From Faint Shakes to Constant Vibration
Early signs in the shaking ground
A large eruption almost never arrives without any preparation. Deep below ground, molten rock starts to move and press on the surrounding rock. That pressure creates tiny fractures and slips that show up as small earthquakes.
Sensitive seismometers can record these early tremors long before anyone feels them at the surface. At first, the pattern may look like scattered, weak events at different depths. Over time, the character of the shaking can change: more frequent quakes, shifting locations, and a gradual move from sharp, short events to a more continuous vibration known as tremor.
This tremor often points to magma or gas moving in a more steady way through cracks and conduits. On some frequently watched peaks, researchers even look at background seismic “noise” that is always present. Small changes in that constant hiss can hint that pressure from magma and gas is building.
When the quiet gaps disappear
If unrest grows, the records can shift from occasional rumbles to an almost unbroken buzz. Earthquake counts may climb rapidly, and individual signals begin to overlap so closely that the instruments record something like many drums playing at once.
At the same time, other hints may appear. The surface can swell slightly where magma intrudes and pushes rock outward. Plumes of gas and steam may increase, sometimes changing in height or composition as deeper sources become involved.
None of these signs alone guarantees an eruption, and many active episodes calm down again without dramatic events. Still, when scattered rumbles grow into continuous shaking and are joined by ground swelling and stronger gas release, the volcano is unsettled and deserves careful attention.
To keep track of these different styles of shaking, specialists often compare several aspects at once, as in the table below.
| Signal type | What changes over time | Typical interpretation guide |
|---|---|---|
| Short, sharp quakes | Number, depth, spacing | Rock breaking as stress increases |
| Continuous tremor | Strength, duration, dominant tones | Fluid or gas moving more steadily underground |
| Background noise level | Subtle shifts in overall amplitude | Possible rise or fall in internal pressure |
| Event patterns | Clustering, migration in space | Paths of magma or fluid through the crust |
Watching Slopes Lift, Lean, and Settle
Rocky cones and ridges may look fixed, but their shapes are quietly changing. The ground can rise by tiny amounts, tilt slightly, or sink back again. These subtle motions can point to magma or hot fluids moving below the surface, even when there is no ash, lava, or obvious surface change.
Many monitoring teams describe this slow rise and fall as a kind of “breathing.” Inflation, when the ground swells upward or outward, can indicate that pressure is building. Deflation, when the surface settles, can follow if magma drains away or gas pressure is released. These signals help locate active zones and show how quickly conditions are changing.
Instruments that feel tiny motions
Several tools work together to track these shape changes. GPS receivers placed on the ground measure how a point moves in three dimensions over time. Tiltmeters act like extremely sensitive spirit levels, picking up very small rotations as a slope swells or sags. Used together, they can show whether a crater rim, flank, or nearby ridge is leaning, stretching, or lifting.
From above, radar instruments on satellites compare repeated images of the same area. By analyzing differences between these images, a method often known by its technical term InSAR can reveal uplift or subsidence over wide regions, even in places where few instruments can be safely installed. This view is especially valuable for peaks that are hard to reach or often covered by snow, ash, or clouds.
Shape change data become more informative when combined with other observations. For example, uplift that appears at the same time as deeper earthquakes and a rise in gas output is more likely linked to magma intrusion than to slower, unrelated processes. By mapping where hills breathe and rocks bend, monitoring teams build a picture of a volcano’s current state and how it might evolve.
Heat, Plumes, and What Remote Eyes Detect
Standing near an active crater, human senses only reveal part of the story. The hottest areas may be buried beneath rock or hidden by dense gas. Instruments that detect infrared light, which is related to temperature rather than visible brightness, reveal heat patterns that ordinary cameras cannot see. Fresh lava, even when covered by a thin crust, stands out clearly in these images.
From above, a thermal camera records bright spots along cracks, vents, domes, and lava lakes. By revisiting the same area repeatedly, those bright pixels can be turned into a timeline. New vents may appear, old flows gradually cool, and hidden eruptions can be tracked through clouds or night. On distant worlds where direct visits are rare, such glowing pixels may be the only practical evidence of ongoing eruptions.
Explosive activity can send clouds of ash and gas high into the sky, where they can pose risks to aviation and influence weather and chemistry. From the ground, such a plume may look like a gray column with few details. From orbit, sensors tuned to different wavelengths can separate ash, water clouds, and tiny ice particles.
Remote sensing teams often build “synthetic” satellite images by mixing estimated plume properties with models of the surrounding air. Comparing these synthetic views with real observations can make it easier to pick out layers of ash, moving jets, or pockets rich in certain gases inside a cloud. Similar approaches are used on other planetary bodies, where probes combine heat maps, images, and radio measurements to follow plumes and estimate how much material each outburst may release.
To decide which remote tools are most useful in a given situation, teams may consider trade‑offs like those in the table below.
| Method | Main strength | Typical limitations or trade‑offs |
|---|---|---|
| Ground thermal cams | Detailed, close‑up heat patterns | Limited view, affected by weather and safety |
| Satellite infrared | Wide coverage, works through darkness | Coarse detail, obstructed by thick clouds |
| Visual cameras | Easy to interpret images and video | Poor for hidden heat and gas inside clouds |
| Radar from orbit | Detects surface change under some cover | Requires processing and repeated passes |
From Streams of Data to Clear, Practical Alerts
Making sense of scattered signals
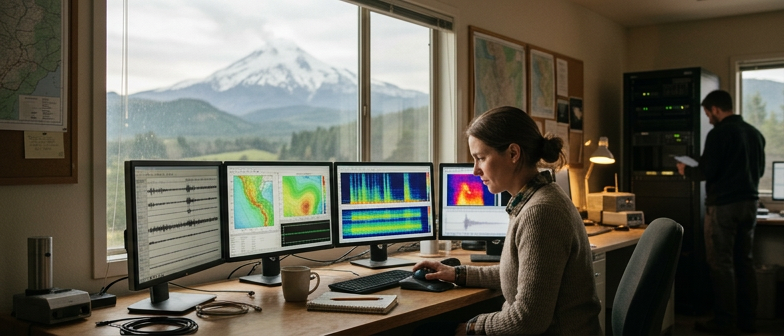
An active volcano generates a constant stream of information. Ground sensors record shaking, instruments track surface motion, cameras capture glowing lava or ash, and satellites watch both the slopes and the downwind sky.
Specialists start by cleaning and organizing the data. They remove obvious errors, compare readings from different instruments, and look for repeating patterns. A cluster of small quakes, gentle uplift seen in radar data, and an increase in thermal brightness together can suggest that magma is moving upward, even if the volcano appears calm to someone visiting in person. With fast processing tools, teams can also compare current behavior with earlier unrest or known past eruptions.
Turning interpretation into guidance
Raw measurements are hard to act on, so monitoring groups translate their interpretations into simple, understandable alert levels. Team discussions focus on what the combined signals imply for likely outcomes: is behavior steady, slowly rising, or starting to ease? The result is usually expressed through a small number of stages, each linked to clear language and suggested actions.
One stage may represent background conditions, another may signal increased unrest, and higher stages may indicate that eruptive activity is underway or that impacts are expanding. Moving between stages is based on defined criteria, such as stronger shaking, faster ground movement, more energetic lava flows, or ash rising higher and drifting farther.
These alerts support decisions in many areas, from aviation routing and outdoor access to emergency planning near the slopes. Trails might close, flight paths might shift, or nearby communities might review evacuation plans. In this way, faint vibrations, subtle surface changes, and tiny shifts in satellite pixels are turned into practical guidance that helps people and organizations prepare for changing conditions around active volcanoes.
Q&A
-
How does modern volcanic activity monitoring integrate different data streams in practice?
Volcanic activity monitoring blends seismic networks, gas sensors, thermal cameras, deformation instruments, and satellite data into a single real‑time system. Automated tools flag changes in seismic signal detection, gas emission tracking, and ground deformation measurements, while experts interpret patterns over days to years to refine eruption warning systems and reduce false alarms. -
What makes seismic signal detection so central to eruption warning systems?
Seismic signal detection reveals where and how energy is being released inside the volcano, often earlier than any surface sign. Analysts separate rock‑breaking quakes, low‑frequency events, and continuous tremor, then compare these with ground deformation measurements and gas data. Consistent changes across multiple parameters usually carry more weight than any single dramatic earthquake. -
Why is gas emission tracking crucial for hazard preparedness science?
Gas emission tracking directly probes magmatic degassing, which often shifts as magma rises or stalls. Ratios of CO₂, SO₂, and H₂O, combined with plume height and wind data, help estimate flux and depth of sources. When rising gas flux aligns with elevated seismicity and uplift, hazard preparedness science can justify stronger alerts or expanded exclusion zones. -
How do ground deformation measurements support long‑term earth process observation?
Ground deformation measurements, from GPS and InSAR to tiltmeters, record slow inflation and deflation cycles that may span months or decades. These time series reveal how magma reservoirs recharge, leak, or connect to regional faults. Such earth process observation improves conceptual models, informing land‑use planning and future monitoring strategies beyond a single crisis. -
In what ways are eruption warning systems evolving with new technology and data science?
Eruption warning systems increasingly use machine learning to classify seismic signals, forecast gas trends, and detect subtle thermal changes automatically. Cloud platforms merge in situ and satellite observations, enabling near‑global volcanic activity monitoring. Probabilistic tools express uncertainty more clearly, helping decision‑makers weigh trade‑offs between false evacuations and delayed responses.