Tracing Vanishing Ice: Satellite Glacier Retreat Records and Mountain Water Futures
Across high mountains and polar coastlines, once‑stable white rivers are thinning, shrinking, and reshaping downstream life. From orbit, finely calibrated sensors now watch these changes season after season, turning shifting contours of ice into numbers that say something about water security, evolving hazards, and the pace of a warming world.
This story is part of DailySeekers's practical reading library across everyday topics.
From orbit to ice edges: turning white shapes into measurements
Seen from space, glacier change is first a question of edges: where the ice ends today and where that limit sat in earlier images. Optical sensors capture visible and infrared light, while radar can add information even when clouds block the view. Each overpass delivers a new outline of the glacier and the contrast between snow, clean ice, and bare rock.
By comparing scenes from different years, specialists trace those outlines into maps. The distance between former and current fronts becomes a measured retreat along the valley floor. Repeating this exercise across many valleys builds time series that reveal whether loss is steady, slowing, or accelerating, and how it relates to changing air temperature, snowfall, or melt‑season length.
The snowline offers another important signal. In late‑season images, the line between bright seasonal snow and darker, older ice often marks the boundary between winter accumulation and summer melt. Tracking how high that line climbs each warm season, and how this pattern shifts over decades, helps translate two‑dimensional patterns into something closer to volume change.
From edges to thickness and volume
Edges alone do not say how thick the ice is, so maps of retreat are often combined with elevation information. Repeated measurements of surface height show whether a glacier is thinning and by how much. When those elevation changes are linked with snowline positions and simple energy‑balance models, the outlines on satellite scenes can be converted into estimates of lost volume and mass.
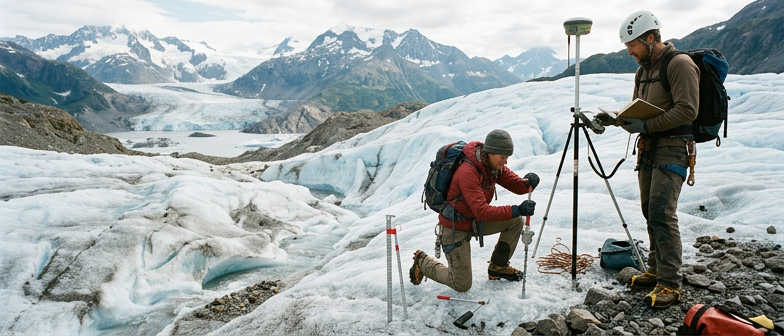
Field observations of snow depth, ice density, and melt rates help test and improve the methods used on satellite data. Long sequences of images and surface information allow researchers to turn fading white patches into numbers for water planning, studies of rising seas, and assessments of local risk.
| Observation type | Main strength in tracking change | Typical limitation or trade‑off |
|---|---|---|
| Optical imagery | Clear, intuitive ice and snow boundaries | Needs daylight and relatively clear skies |
| Radar imagery | Sees through many clouds and some darkness | Harder to interpret surface details |
| Elevation mapping | Direct view of thinning or thickening | Updates less frequently than simple images |
Following the climbing snowline and shifting melt
The snowline reflects the balance between gain and loss. When the average late‑season snowline rises higher on the mountain, the accumulation area where snow survives into the next year usually shrinks. Over time, that tends to make the glacier thinner and shorter.
Sensors can follow this shifting line from year to year. In warm summers, it may climb rapidly and stay high. In cooler or snowier seasons, it may drop or stall lower on the slope. Over longer periods, the pattern of where the snowline spends most of its time tells a story about how much ice the glacier can retain.
Linking snow patterns with energy and mass
Snowline maps become more powerful when combined with simple representations of the energy available for melt. Darker, older ice absorbs more sunlight than fresh snow, and bare rock absorbs even more. As the snowline climbs and dark surfaces are exposed for longer periods, additional energy is available to melt the underlying ice.
By pairing the mapped line with air temperature and precipitation records, analysts can estimate how much of the observed change comes from warmer conditions, and how much from altered snowfall or rain‑on‑snow events. That helps explain why some glaciers lose ice faster than others, even within the same mountain range.
Elevation data tie this together by showing where the snowline passes from year to year relative to the glacier’s thickness. If the line spends more time over areas where the ice was once thickest, mass loss can accelerate. This blend of snowline tracking, surface height change, and simple physics allows two‑dimensional pictures from space to inform three‑dimensional estimates of stored water.
When shrinking ice feeds rivers: water quantity, timing and character
Melting ice does not immediately mean less water in streams. As a glacier thins and its front retreats, more of its surface can sit in the melt zone, where temperatures remain high enough to turn solid ice into liquid water for much of the warm season. In some mountain regions, much of the loss occurs below a certain elevation, where meltwater pulses directly into rivers.
For a period, this can lead to higher late‑spring and summer flow. Field campaigns that track glacier length, thickness, and overall mass show that strong retreat and thinning often coincide with shifts in when and how much water reaches downstream gauges. Early in the season, rivers may rise sooner and peak earlier, then drop more sharply when high‑elevation ice can no longer provide sustained melt.
From extra flow to less reliable seasons
The key change over longer timescales is not only how much water flows, but when. Once a glacier has lost enough of its volume, the temporary boost in runoff tends to fade. Rivers that once depended on steady melt in dry months can show more pronounced swings: strong flow during warm spells and storms, followed by more extended low‑water periods later in the year.
Retreat also alters the character of the water itself. Faster melt exposes more rock, debris, and soil, influencing how streams pick up minerals and heat as they move downhill. Observations from glacier‑fed valleys suggest that meltwater can become warmer and more chemically stable, with fewer abrupt shifts tied to short cold or warm events.
For communities, farmers, and ecosystems, these changes matter for storage decisions, timing of withdrawals, and expectations about both flow and water quality. Planning based on long‑term records of ice change and river response can help reduce surprises as the balance between seasonal snow, glacial melt, and rainfall evolves.
| Glacier condition | Typical river response | Main planning concern |
|---|---|---|
| Thick ice with modest retreat | Fairly steady melt contribution in dry months | Matching storage to predictable seasonal flow |
| Rapid thinning and strong retreat | Temporary increase and earlier peak in warm‑season flow | Adjusting to shifting timing and possible short‑term surpluses |
| Strongly reduced ice volume | More extreme swings and longer low‑flow periods | Securing alternatives and managing shortages |
Why long records change how the story is read
Isolated dramatic moments often draw public attention: a glacier terminus jumping back a long distance in a short period, large ice blocks breaking away, or an unusually rapid retreat season. These events are important, but they are more like vivid chapters than a complete narrative.
Extended records, spanning many decades, show whether a glacier is truly shrinking or simply reacting to an unusual sequence of seasons. Year‑to‑year weather can be noisy, while multi‑decade measurements filter that noise to reveal persistent retreat and mass loss. With carefully gathered long‑term data, shifts in melt energy also become clearer. A sustained rise in the energy available for melting, often linked to darker summer surfaces and warmer conditions, helps explain why ice loss in many areas continues instead of stabilizing after a few bad years.
From past losses to future options
Thinking of glaciers as savings accounts for water provides a useful analogy. Long records show how quickly that stored resource has been drawn down and whether seasonal deposits from snowfall still keep pace. If the balance has been declining for many decades, meltwater that once buffered dry periods is less likely to remain reliable in the future.
Extended observations also help separate different loss patterns. Some glaciers mainly thin from surface melt; others retreat quickly because flowing ice or surrounding water undercuts their fronts, or because their shape makes them unstable once they pass a certain thickness. Understanding which processes dominate for a particular glacier supports more realistic projections of future river flow and contribution to rising seas.
Careful interpretation of combined surface measurements, snowline histories, and gravity‑based estimates of mass change reduces the risk of misreading short‑term fluctuations. For regions that rely on predictable meltwater, this kind of long‑term perspective is central to planning reservoirs, hydropower facilities, agriculture, and local adaptation strategies in a steadily changing mountain water system.
Q&A
-
How do modern Glacier Retreat Measurement methods improve our understanding of regional water security?
Glacier retreat measurement now combines precise length change, surface elevation, and mass balance estimates, giving planners a clearer sense of how much stored water remains and how quickly it is being depleted. When linked with river flow records, these measurements help distinguish temporary meltwater increases from long‑term declines in reliable dry‑season supply. -
Why is Ice Loss Tracking considered a critical Climate Change Indicator rather than just a local glacier issue?
Ice loss integrates changes in air temperature, precipitation patterns, and surface darkening over many years, making it a sensitive climate change indicator. Unlike short‑term weather statistics, sustained mass loss from multiple glacier regions signals a persistent energy imbalance in the climate system, with implications for sea level, water resources, and regional hazard profiles. -
What advantages do Satellite Observation Tools offer over ground measurements in Cryosphere Science Basics?
Satellite observation tools provide consistent, repeatable coverage across remote mountain ranges and polar areas where fieldwork is difficult or dangerous. They deliver standardized datasets that allow scientists to compare glacier behavior between continents, build regional inventories of ice volume change, and detect emerging hotspots of rapid thinning that may otherwise go unnoticed. -
How do Long Term Data Records change the way Mountain Water Systems are modeled for the future?
Long term data records reveal how mountain water systems responded to past warming phases, droughts, and shifts in snow versus rain. Modelers use these histories to calibrate runoff and glacier models, reduce uncertainty in future scenarios, and test whether proposed reservoir or hydropower strategies remain robust under multiple climate projections. -
In practical terms, how can non‑specialists use basic Cryosphere Science knowledge in local planning?
Non‑specialists can interpret simple graphics of glacier area, snowline height, and seasonal runoff as early warnings about changing water reliability. Understanding cryosphere science basics helps communities question whether current infrastructure assumes stable ice storage, and encourages investments in diversified water sources, demand management, and climate‑resilient land use.